
ROLE Information Designer
DURATION 1 month
TECHNOLOGY R Stats Package, Illustrator, Photoshop, Webflow
AWARDS Illinois College Press Association award for Graphic Illustration, First Place, Pacemaker Design of the Year Informational Graphic (first place), Pacemaker Story of the Year Interactive Graphic (fifth place), IIB Longlist
Context:
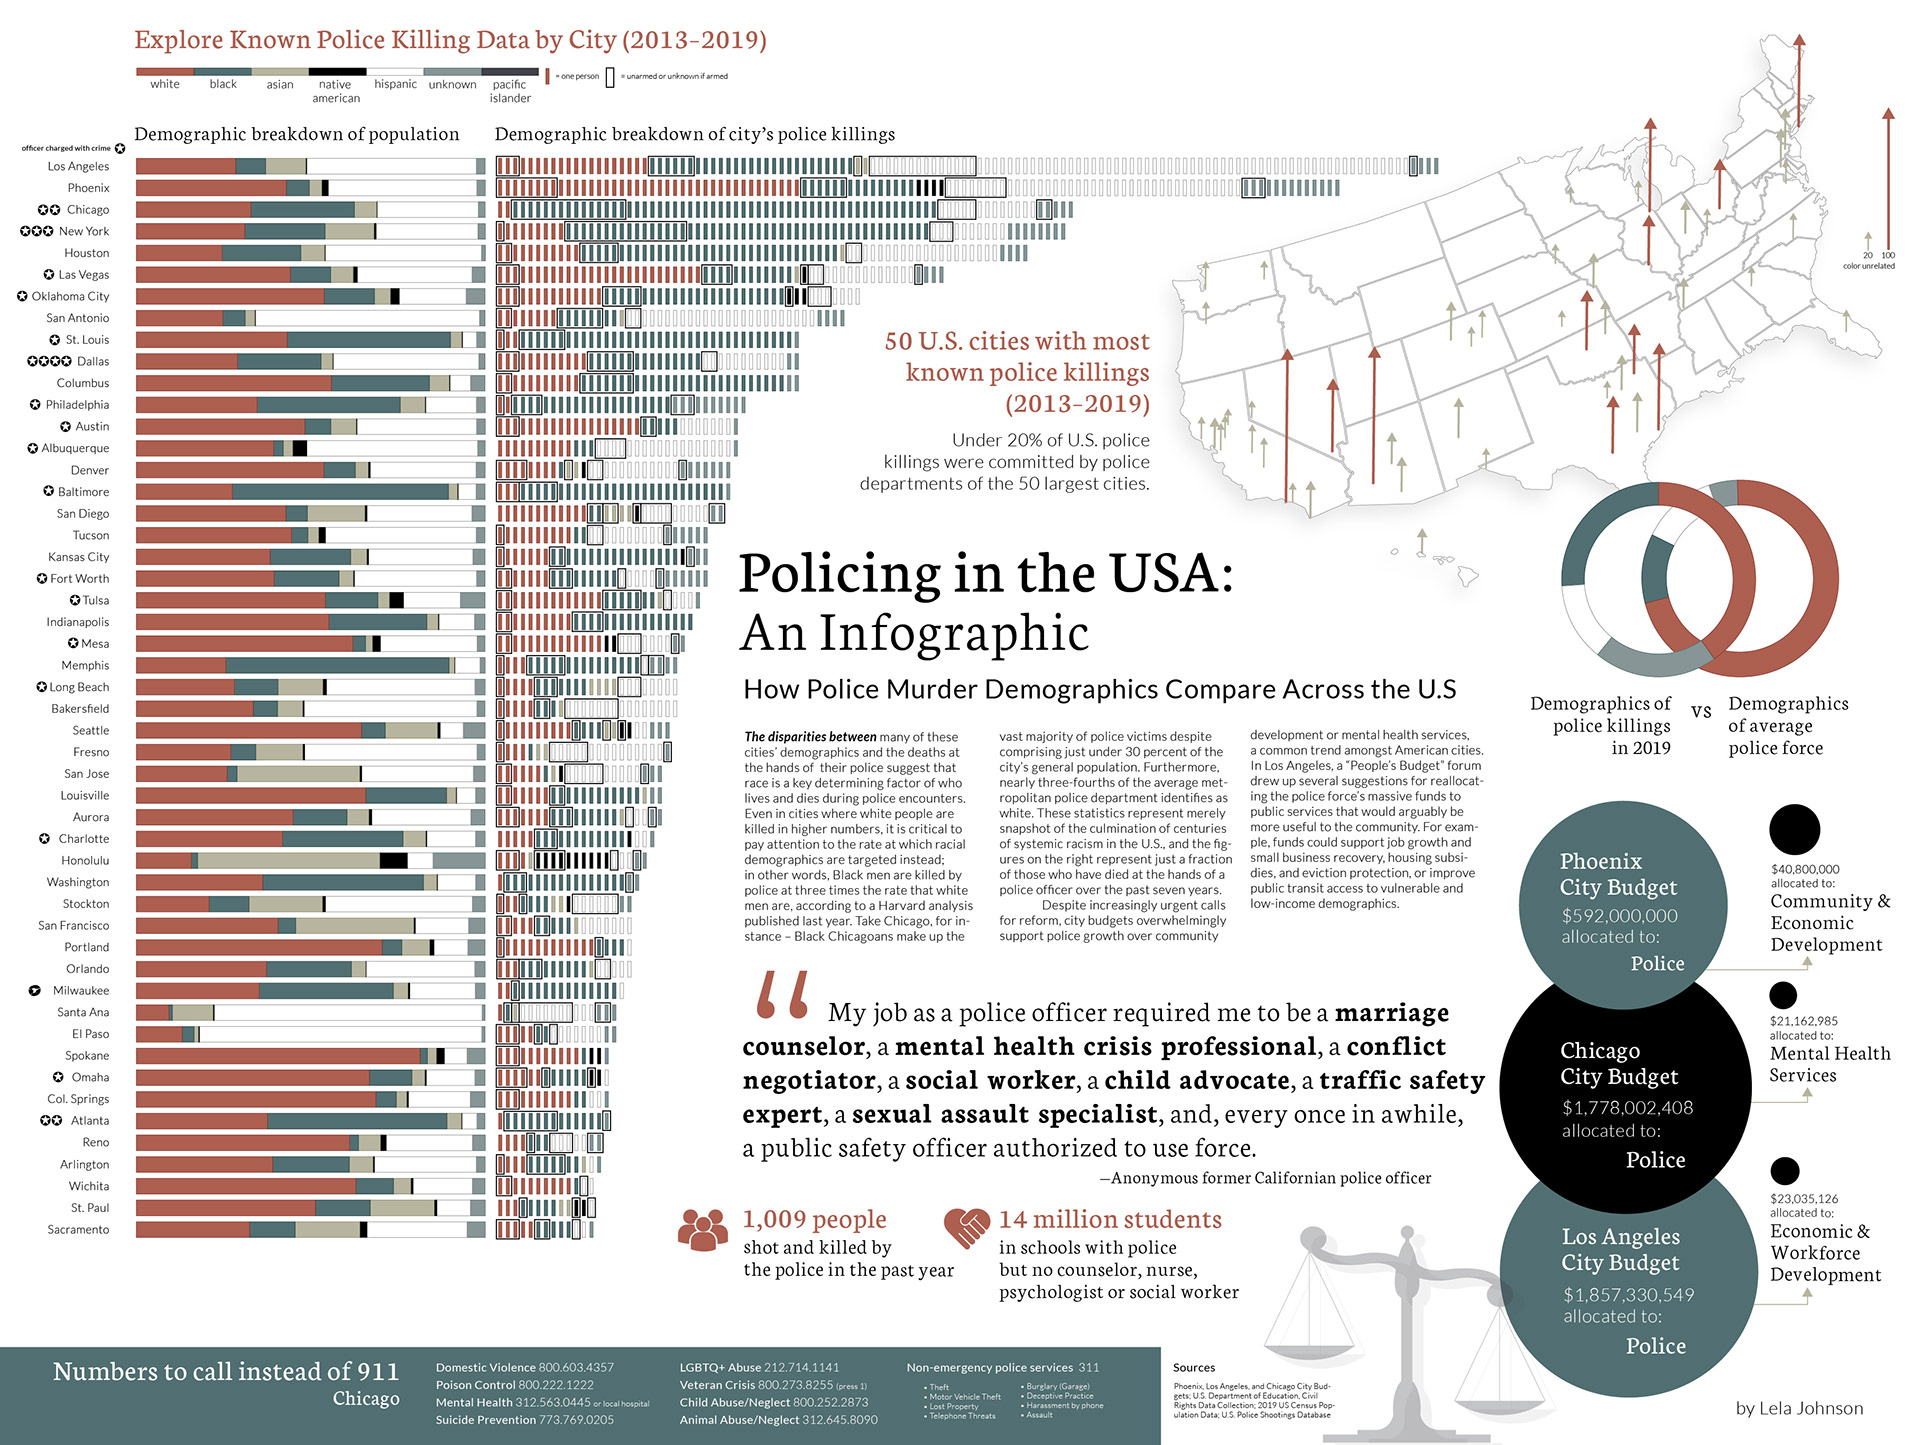
The disparities between many of the following cities’ demographics and the deaths at the hands of their police suggest that race is a key determining factor of who lives and dies during police encounters. Even in cities where white people are killed in higher numbers, it is critical to pay attention to the rate at which racial demographics are targeted instead; in other words, Black men are killed by police at three times the rate that white men are, according to a Harvard analysis published last year.
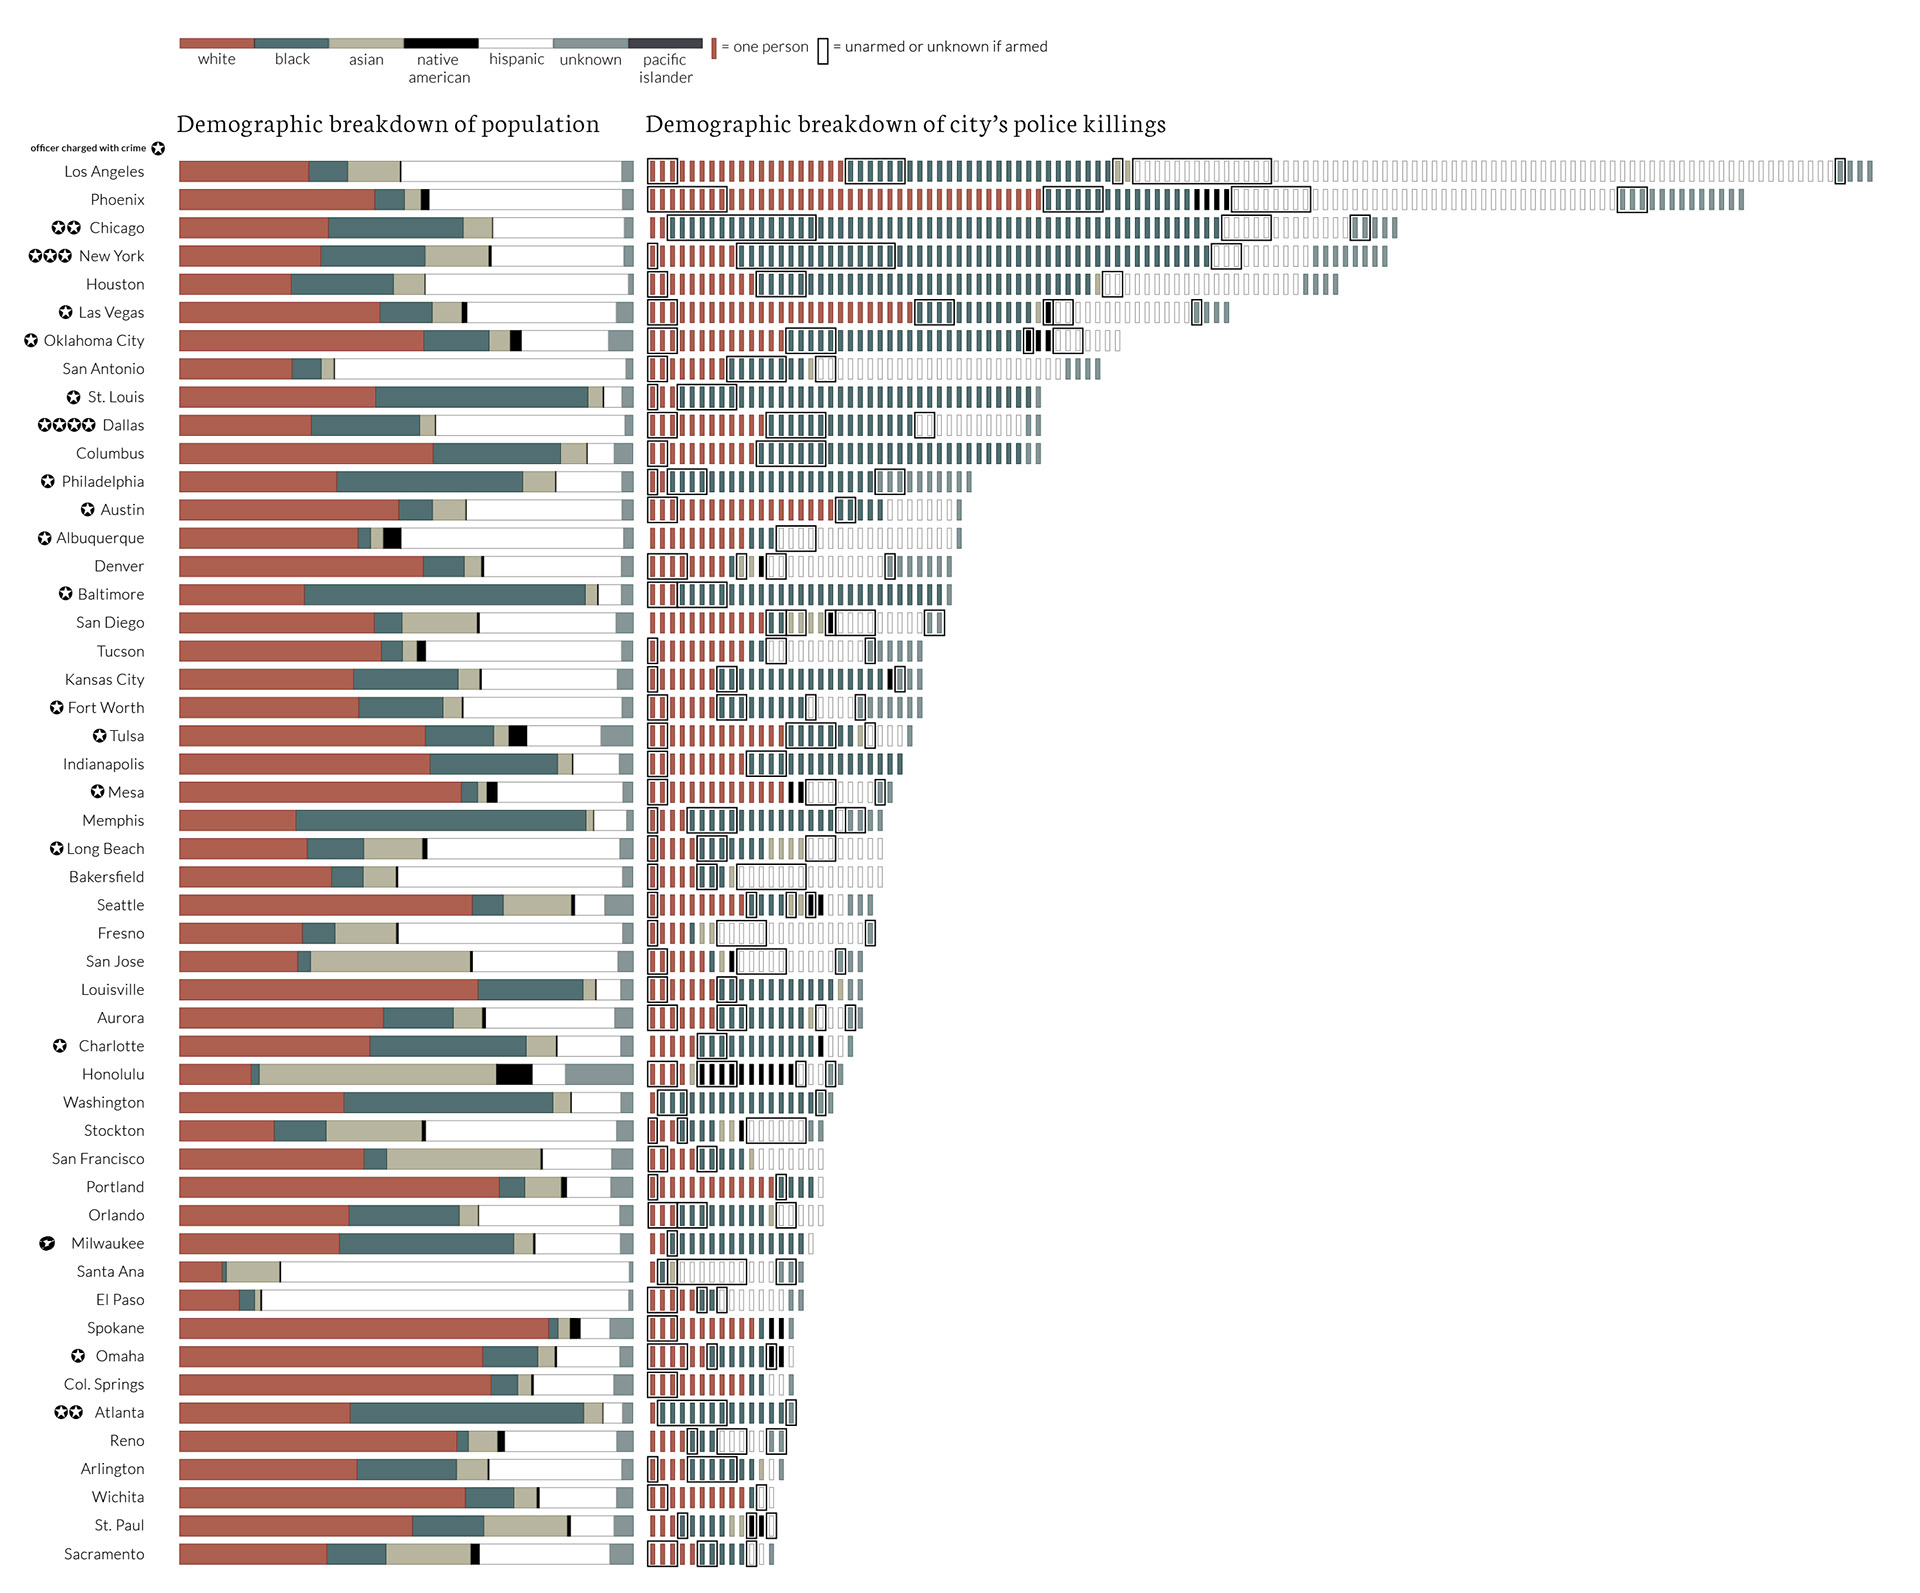
Take Chicago, for instance: Black Chicagoans make up the vast majority of police victims, despite comprising just over 30 percent of the city’s general population.
50 U.S. cities with most known police killings (2013–2019)
Under 20 percent of U.S. police killings were committed by police departments of the 50 largest cities.
Furthermore, nearly three-fourths of the average metropolitan police department identifies as white. These statistics represent merely snapshot of the culmination of centuries of systemic racism in the U.S., and the figures on the right represent just a fraction of those who have died at the hands of a police officer over the past seven years.
Despite increasingly urgent calls for reform, city budgets overwhelmingly support police growth over community development or mental health services, a common trend throughout American cities.
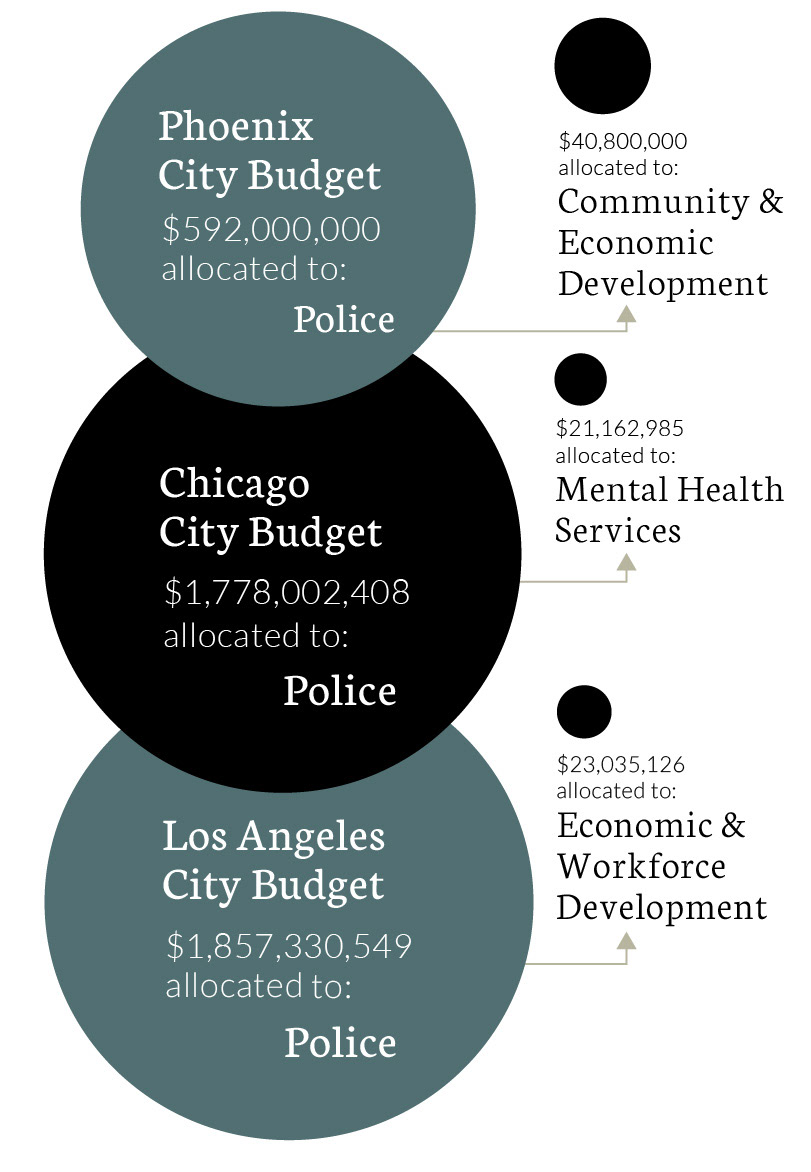
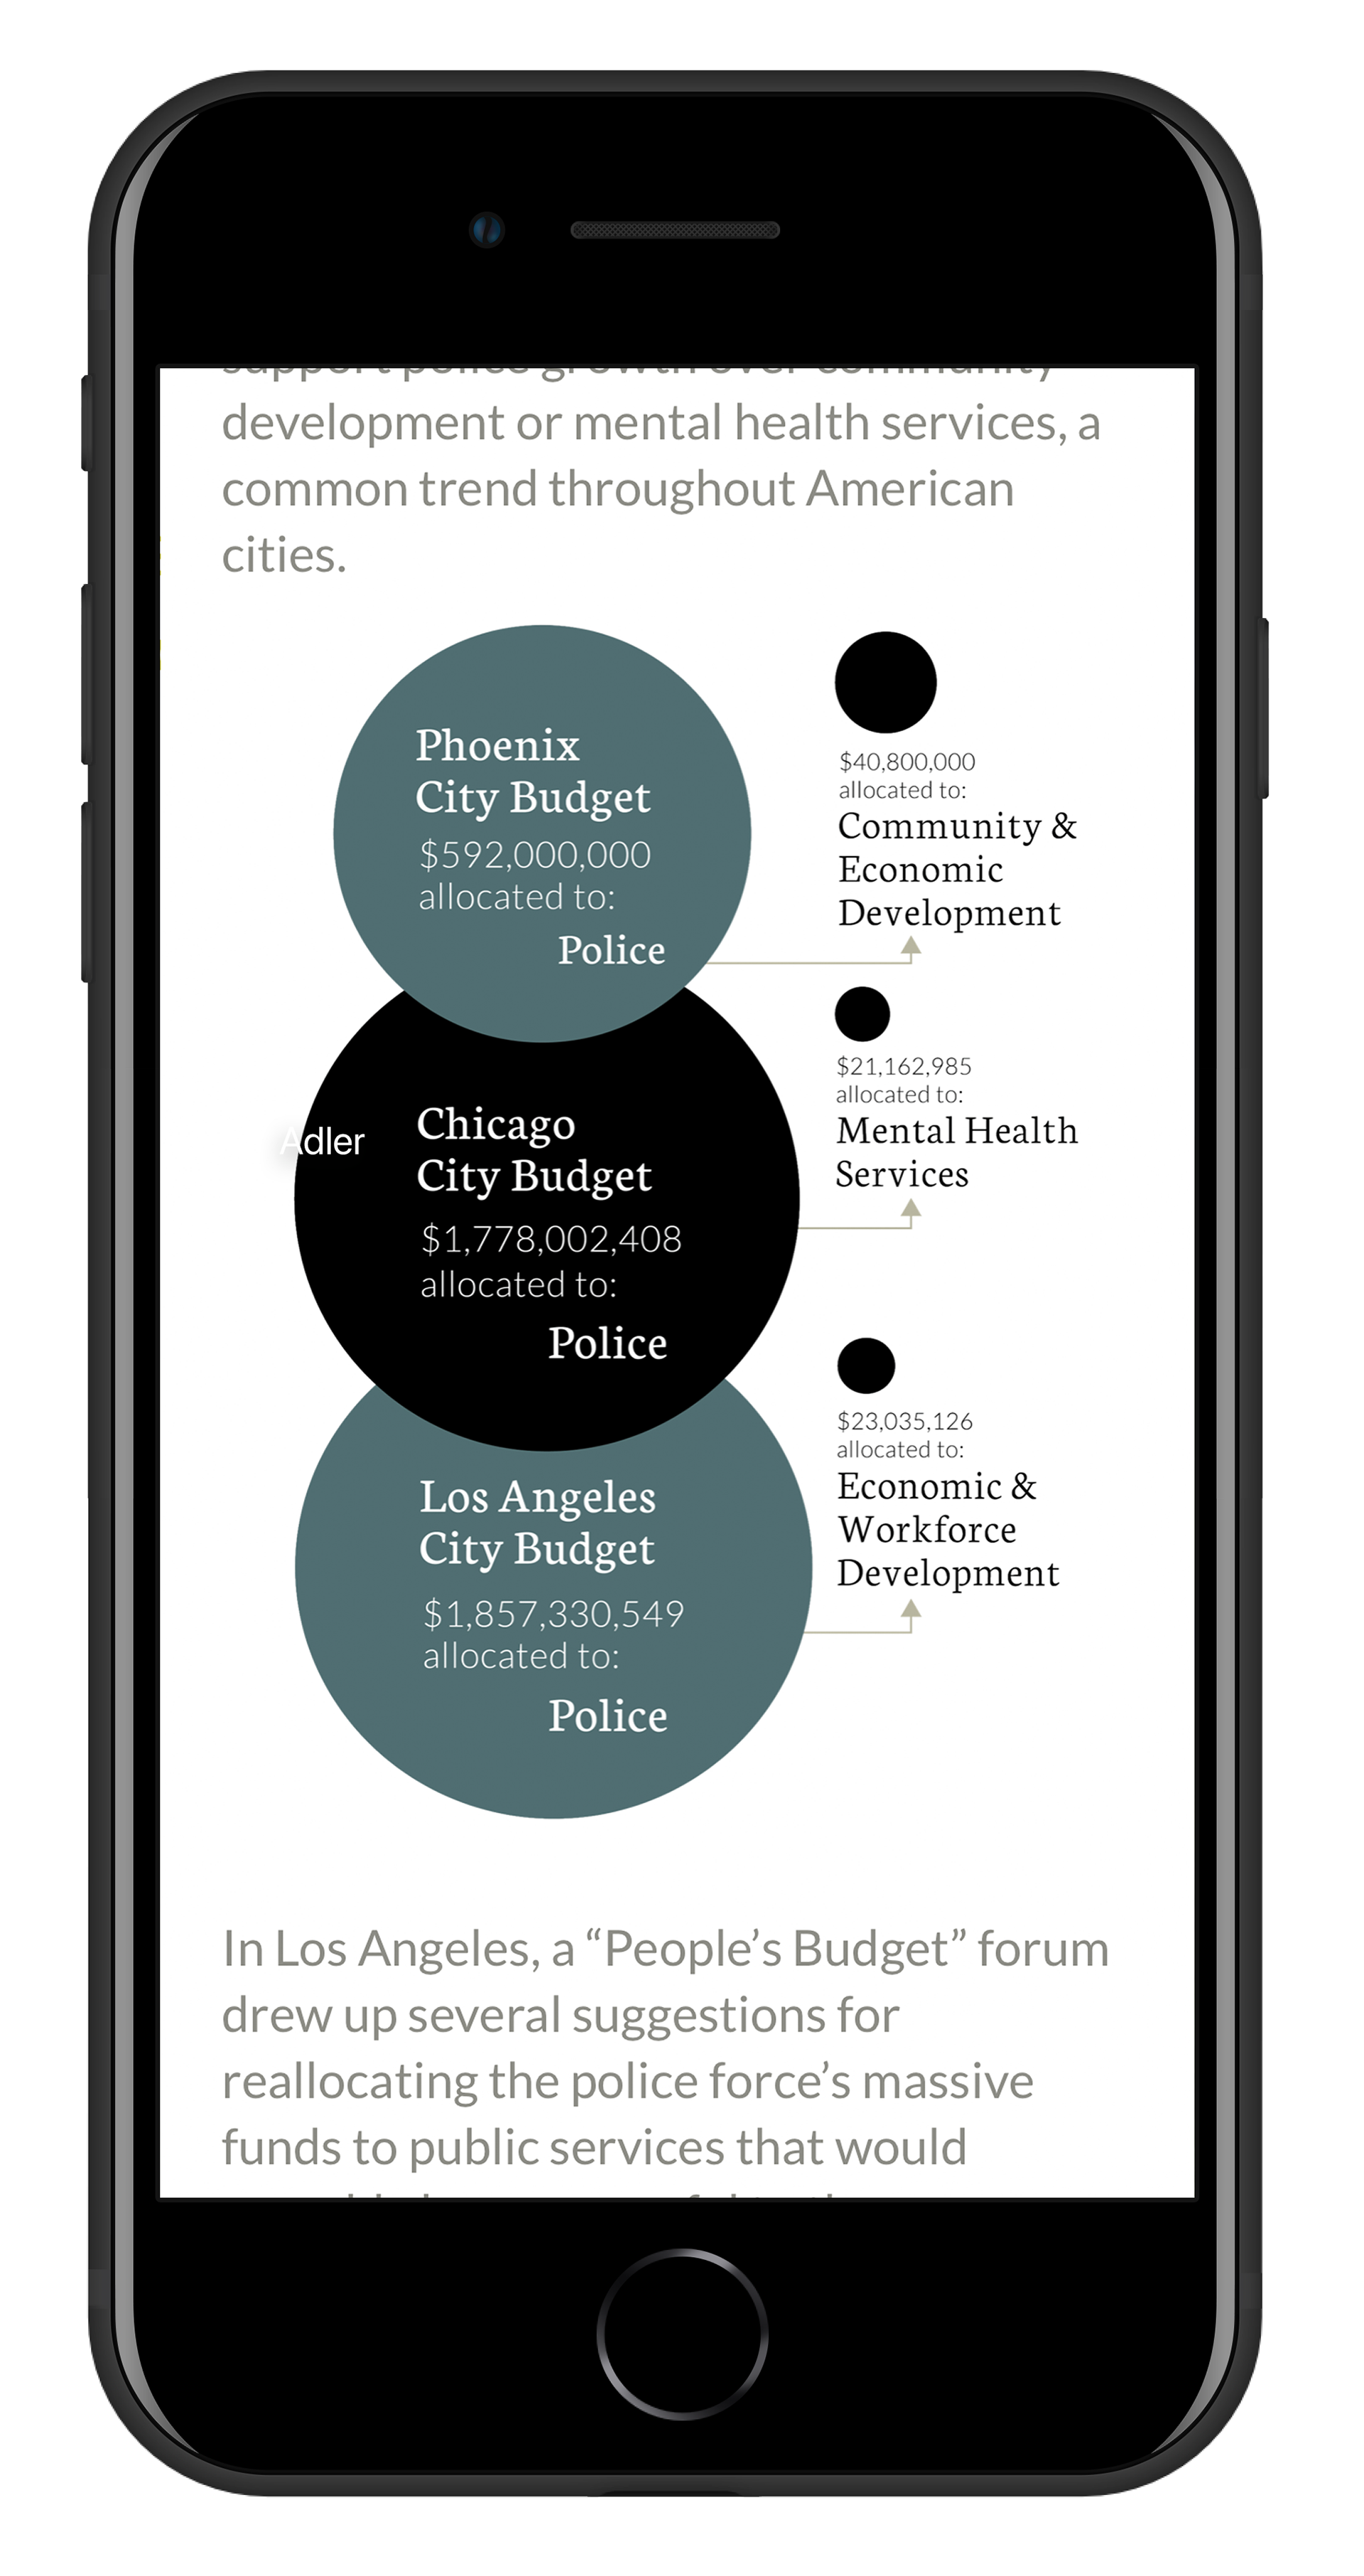
In Los Angeles, a “People’s Budget” forum drew up several suggestions for reallocating the police force’s massive funds to public services that would arguably be more useful to the community. For example, funds could support job growth and small business recovery, housing subsidies, and eviction protection, or improve public transit access to vulnerable and low-income demographics.
Background research:
For this project, I analyzed several city budgets in order to understand how police departments operate under the lens of local government. I specifically focused on the three cities recording the highest levels of civilian death at the hands of the local police force: Phoenix, Los Angeles, and Chicago.
Next, I compiled a comprehensive database of police killings in recent years and sought out patterns to highlight, incorporating important factors such as race and whether or not the victim was armed.
Creative direction:
We adopted a flexible grid system to compartmentalize content within Webflow. I focused on breaking down excerpts of text and how I incorporated illustrations and interactivity in order to facilitate reader flow for both desktop and mobile.
I mirrored the magazine issue's goal to keep graphics visually clean and succinct, taking advantage of cutouts and negative spaces, to achieve a cohesive yet diverse visual system.