ROLE Information Designer, team of 2
DURATION 2 months
TECHNOLOGY Illustrator, Photoshop, inDesign
AWARD International Institute for Information Design Award, Communication Arts feature
Project statement written by Stephen Farrell
DURATION 2 months
TECHNOLOGY Illustrator, Photoshop, inDesign
AWARD International Institute for Information Design Award, Communication Arts feature
Project statement written by Stephen Farrell
Context:
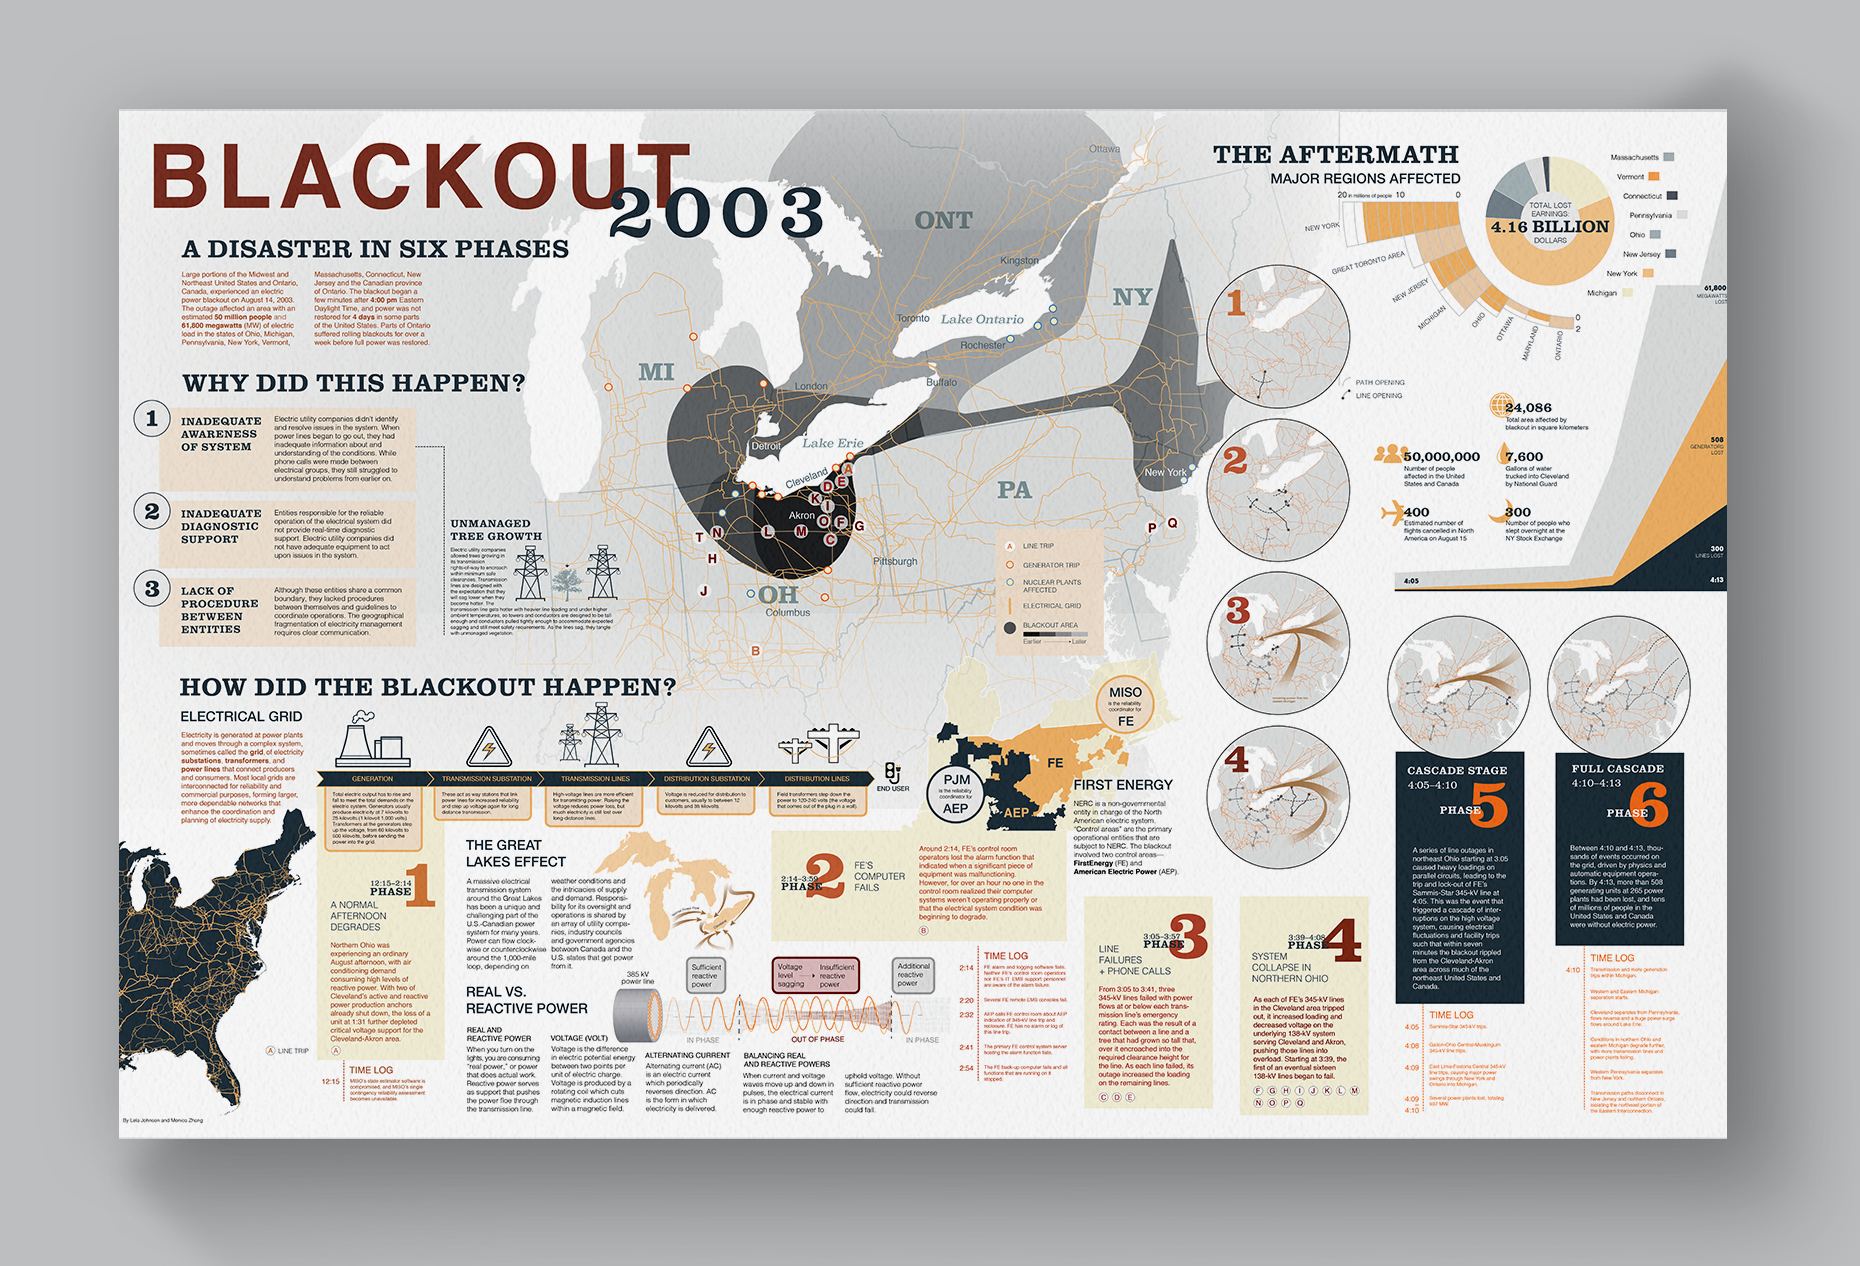
On August 14, 2003, in what seemed like the blink of an eye, hundreds of cities across the midwest and northeast went dark as the United States experienced the worst blackout in its history. Buildings, subways, elevators were evacuated, computers and electric billboards blinked off, airports were disrupted, air conditioners and fans halted amidst the summer heat, and news agencies scrambled to cover the story and uncover just what had happened and who—or what—was to blame.
Over the course of months, the story grew more complex as more nuanced aspects of the blackout emerged. We all became armchair experts on the fragmentation of the power grid, real versus reactive power, and the interconnectedness of US/Canadian electric. And what better way to learn about these macro-concepts, than to analyze one material moment, one traceable chain of human and machine events that reveals the totality of the state of electricity in North America.

Background research + objectives:
> Sift through large amounts of complex reportage and pull the most relevant data
> Connect this data into a cohesive, compact, engaging, accurate narrative
> Choose appropriate strategies of display for each part of the narrative
> Combine these display strategies into a cohesive, flowing whole
> Design a narrative that works on both a macro-level and micro-level